
Today’s 10 Best and 10 Worst Performing FTSE 100 Stocks (January 24, 2018)
As of January 24, FTSE 100 Index decreased by 1.14% to 7,643.43. In the following tables, you can see today’s 10 best and 10 worst performing FTSE stocks.
10 Best Performing Stocks
| Company | Price | Daily Return |
|---|---|---|
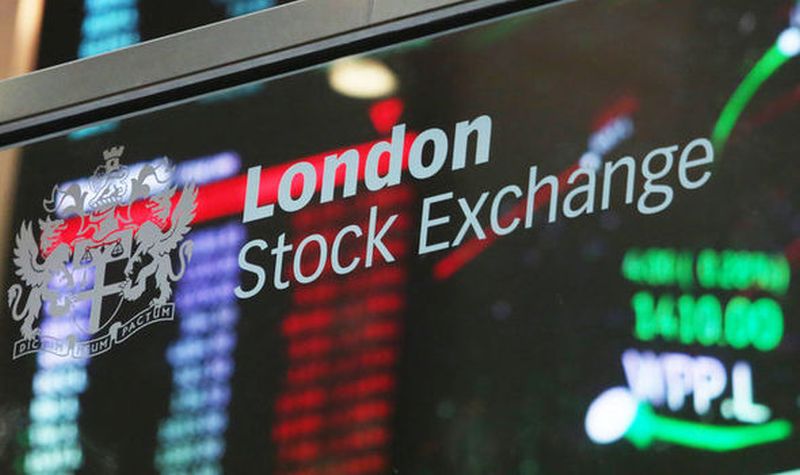
| London Stock Exchange | 3,988.00 | 4.97% |
| Fresnillo | 1,384.50 | 3.71% |
| Randgold Resources | 7,262.00 | 3.04% |
| ITV | 168.00 | 2.35% |
| EasyJet | 1,679.00 | 2.16% |
| Glencore | 397.00 | 1.60% |
| Associated British Foods | 2,784.00 | 1.35% |
| Anglo American | 1,736.80 | 0.80% |
| Old Mutual | 238.90 | 0.76% |
| J Sainsbury | 258.90 | 0.74% |
10 Worst Performing Stocks
| Company | Price | Daily Return |
|---|---|---|
| Sage Group | 768.20 | -6.48% |
| Provident Financial | 702.00 | -3.52% |
| Ashtead Group | 2,086.00 | -3.07% |
| BAE Systems | 565.20 | -3.05% |
| CRH | 2,698.00 | -2.60% |
| AstraZeneca | 4,971.00 | -2.55% |
| Intertek Group | 5,048.00 | -2.51% |
| Compass | 1,506.50 | -2.49% |
| Shire | 3,424.00 | -2.45% |
| British American Tobacco | 4,976.00 | -2.43% |
